


 2 / 184

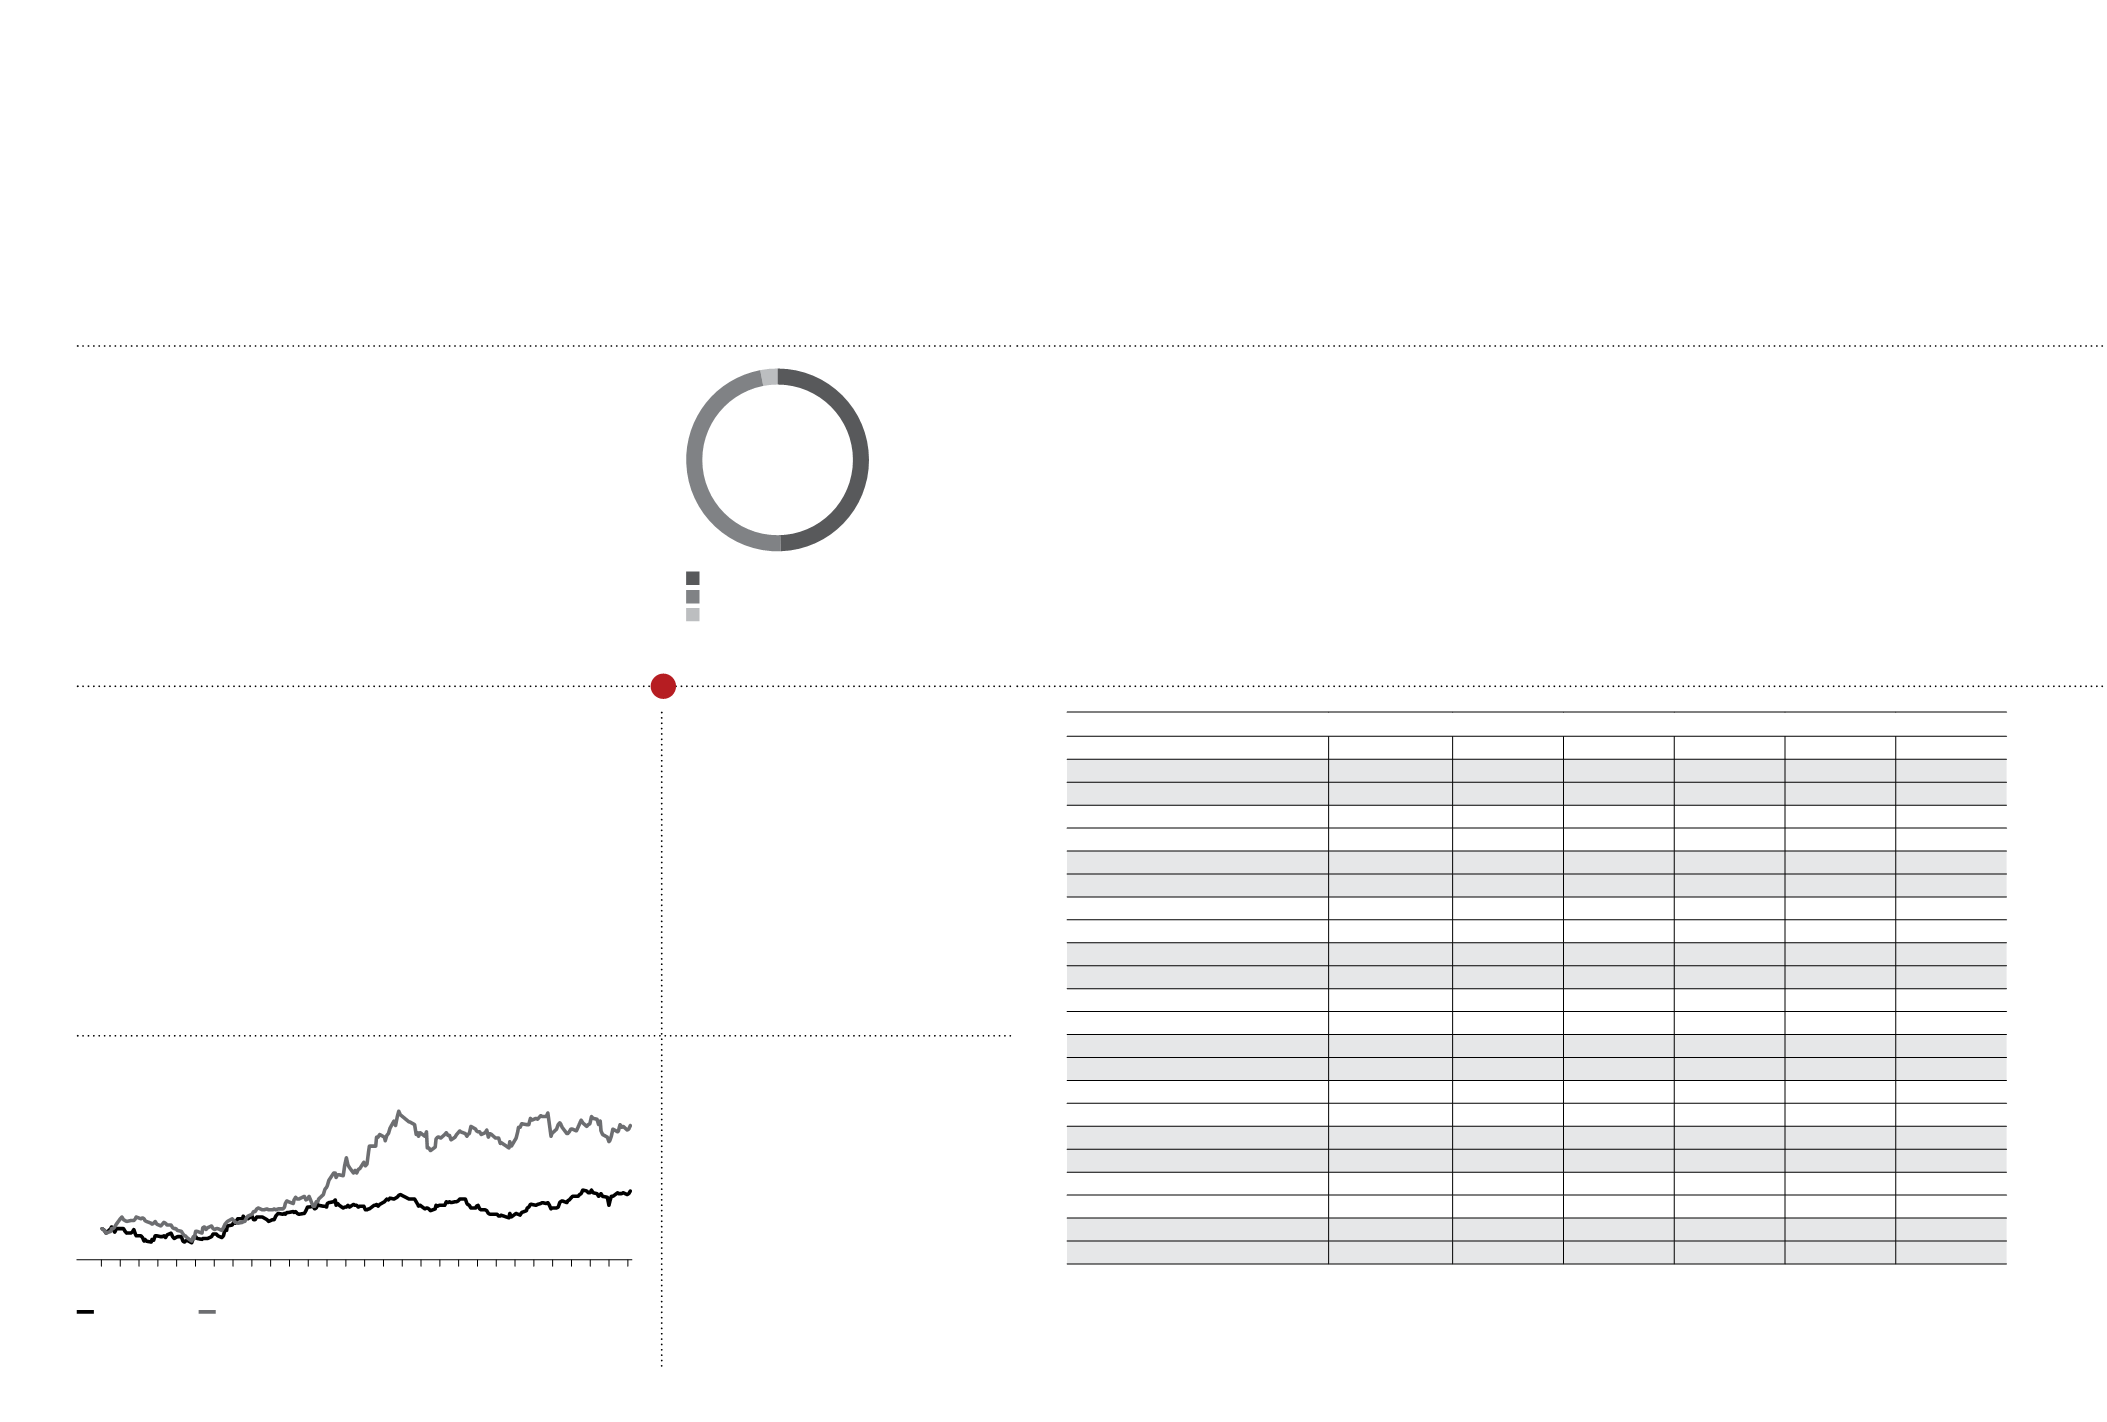
Developments in Ereğli shares
Ereğli shares traded at a price of TL 2.58 per share at the opening on the first
transaction day of 2014, and ended the year at a price of TL 4.46, marking an
increase of 73%.
When compared with the BIST 100 index and based on 31.12.2013=100,
the BIST 100 index had posted an increase of 26% during the 2014 full
year. Meanwhile, Ereğli shares yielded a return of 73%. The extent to which
Ereğli shares outperformed the index resulted in an increase in shareholder
satisfaction and commitment.
Impacted positively by the net dividend payment on May 26, 2014. Ereğli
stock became one of the year’s best performers on the Borsa Istanbul, on
which it has been listed since the establishment of this exchange in 1986, as
well as in the BIST 30 index, which Ereğli is a component of.
73%
EREĞLİ SHARES, WHICH HAVE BEEN
LISTED ON THE BIST 100 SINCE THE
ESTABLISHMENT OF THE STOCK
EXCHANGE IN 1986, POSTED ONE
OF THE HIGHEST RETURNS IN 2014
WITH AN ROI OF 73%.
ERDEMİR GROUP IN SUMMARY
WITH ITS 7 SUBSIDIARIES, THE ERDEMİR
GROUP OPERATES IN THE FIELDS OF FLAT
AND LONG STEEL, STEEL SERVICE CENTER
SERVICES, MINING, ENGINEERING, AND
PROJECT MANAGEMENT.
Shareholding Structure
Ataer Holding A.Ş. 49.29%
Free Float 47.63%
ERDEMİR’s Portfolio 3.08%
Key Financial Indicators
2010
2011
2012
2013
2014
Net Sales Revenue
(TL million)
6,633
8,921
9,570
9,781
11,484
(USD million)
4,427
5,339
5,340
5,142
5,252
Net Operating Profit
(TL million)
1,183
1,957
756
1,538
2,094
(USD million)
789
1,171
422
808
958
EBITDA
(TL million)
1,443
2,073
1,083
1,878
2,484
(USD million)
963
1,241
604
987
1,136
Net Profit
(TL million)
780
1,021
452
920
1,601
(USD million)
521
611
252
484
732
Current Assests
(TL million)
6,325
6,025
5,854
6,008
7,372
(USD million)
4,091
3,190
3,284
2,815
3,179
Fixed Assets
(TL million)
7,216
7,366
7,287
8,026
8,562
(USD million)
4,668
3,900
4,088
3,761
3,692
Total Assets
(TL million)
13,541
13,391
13,141
14,034
15,934
(USD million)
8,759
7,089
7,372
6,576
6,871
Short Term/Current Liabilities
(TL million)
3,716
2,415
2,818
2,475
3,105
(USD million)
2,404
1,279
1,581
1,160
1,339
Long Term Liabilities
(TL million)
3,134
3,688
2,908
2,852
2,518
(USD million)
2,027
1,952
1,631
1,336
1,086
Shareholders' Equity
(TL million)
6,511
7,087
7,205
8,467
10,003
(USD million)
4,212
3,752
4,042
3,967
4,314
Market Capitalization (Annual Average) (TL million)
7,418
8,040
7,120
7,818
12,682
(USD million)
4,950
4,812
3,972
4,110
5,799
ERDEMİR GROUP’S PLACE IN TURKEY
AND THE WORLD
A DEEPLY ROOTED HISTORY AND SENSE
OF RESPONSIBILITY FOR THE FUTURE
SETS THE ERDEMİR GROUP APART WITH
ITS STRENGTH AND COMPETENCY
ERDEMİR GROUP
• IS TURKEY’S ONLY INTEGRATED
PRODUCER OF FLAT STEEL AND THE
SECTOR’S INVIOLABLE LEADER AND
THE MOST ADMIRED COMPANY.
• ACCOUNTED FOR 25% OF TURKEY’S
TOTAL UN-PROCESSED STEEL
PRODUCTION IN 2014.
• RANKED 8TH IN EUROPE AND 3RD
IN THE EU-28 IN TERMS OF ITS UN-
PROCESSED STEEL PRODUCTION IN 2013.
• RANKED AS THE WORLD’S 10TH
BEST STEEL COMPANY ACCORDING
TO A STUDY CONDUCTED BY WORLD
STEEL DYNAMICS BASED ON CRITERIA
SUCH AS CAPACITY, VALUE ADDED
PRODUCT RANGE, PRODUCTION
COSTS, FINANCIAL STRUCTURE AND
COMPETITION.
• ERDEMİR WAS RANKED 8TH, İSDEMİR
9TH, ERMADEN 216TH AND ERSEM
244TH IN THE ISO 500 RANKING
PREPARED ACCORDING TO 2013 DATA.
Stock Tickers
Borsa İstanbul: EREGL
Bloomberg: EREGL TI
Reuters:
EREGL.ISErdemir Share
200
180
160
140
120
100
80
BIST 100
173
126
EREGL Share
(*) The functional currency unit of Erdemir as well as its subsidiaries İsdemir and Ersem was switched to the USD dollar as of July 1, 2013.
(**) Pursuant to the sample financial statements and guidelines that took effect as of interim periods ending after March 31, 2013 for capital markets institutions that fall within the scope of
the Capital Markets Board’s “Communiqué on the Principles of Financial Reporting in Capital Markets” Series: II No: 14.1, in accordance with the Turkish Accounting Standards/Turkish Financial
Reporting Standards published by the Public Oversight, Accounting and Auditing Standards Agency, reclassifications and restatements were made in the past consolidated financial statements due
to the recognition of actuarial loss/income resulting from provisions for employee benefits in comprehensive income statements.
12/31/13
5/10/14
4/14/14
10/26/14
2/21/14
9/4/14
7/14/14
12/4/14
1/26/14
7/1/14
5/23/14
11/21/14
3/19/14
9/30/14
8/22/14
12/30/14
1/13/14
6/5/14
4/27/14
11/8/14
3/6/14
9/17/14
7/27/14
12/17/14
2/8/14
8/9/14
6/18/14
4/1/14
10/13/14